Cesar colour for ggplot2
Usage
scale_colour_cesar_d(
  name = waiver(),
  ...,
  alpha = 1,
  reverse = FALSE,
  palette = "cesar",
  aesthetics = "colour"
)

scale_fill_cesar_d(
  name = waiver(),
  ...,
  alpha = 1,
  reverse = FALSE,
  palette = "cesar",
  aesthetics = "fill"
)

scale_colour_cesar_c(
  name = waiver(),
  ...,
  alpha = 1,
  reverse = FALSE,
  palette = "cesar_green_c",
  guide = "colourbar",
  aesthetics = "colour",
  na.value = "#AFAFAF"
)

scale_fill_cesar_c(
  name = waiver(),
  ...,
  alpha = 1,
  reverse = FALSE,
  palette = "cesar_green_c",
  guide = "colourbar",
  aesthetics = "fill",
  na.value = "#AFAFAF"
)

scale_colour_cesar_b(
  name = waiver(),
  ...,
  alpha = 1,
  reverse = FALSE,
  palette = "cesar_green_c",
  guide = "coloursteps",
  aesthetics = "colour",
  na.value = "#AFAFAF"
)

scale_fill_cesar_b(
  name = waiver(),
  ...,
  alpha = 1,
  reverse = FALSE,
  palette = "cesar_green_c",
  guide = "coloursteps",
  aesthetics = "fill",
  na.value = "#AFAFAF"
)

scale_colour_cesar_g(
  name = waiver(),
  ...,
  mid = 0,
  alpha = 1,
  reverse = FALSE,
  palette = "green_brown_d",
  guide = "colourbar",
  aesthetics = "colour",
  na.value = "#AFAFAF"
)

scale_fill_cesar_g(
  name = waiver(),
  ...,
  mid = 0,
  alpha = 1,
  reverse = FALSE,
  palette = "green_brown_d",
  guide = "colourbar",
  aesthetics = "fill",
  na.value = "#AFAFAF"
)
Arguments
- name
The name of the scale. Used as the axis or legend title. If
waiver(), the default, the name of the scale is taken from the first mapping used for that aesthetic. IfNULL, the legend title will be omitted.- ...
Other arguments passed on to
discrete_scale(),continuous_scale(), orbinned_scale()to control name, limits, breaks, labels and so forth.- alpha
sets transparency of each color
- reverse
if true, reverses the order of palette
- palette
Choose from 'cesar_palettes' list
- aesthetics
Character string or vector of character strings listing the name(s) of the aesthetic(s) that this scale works with. This can be useful, for example, to apply colour settings to the
colourandfillaesthetics at the same time, viaaesthetics = c("colour", "fill").- guide
A function used to create a guide or its name. See
guides()for more information.- na.value
Missing values will be replaced with this value.
See also
The documentation on colour aesthetics.
Examples
library(ggplot2)
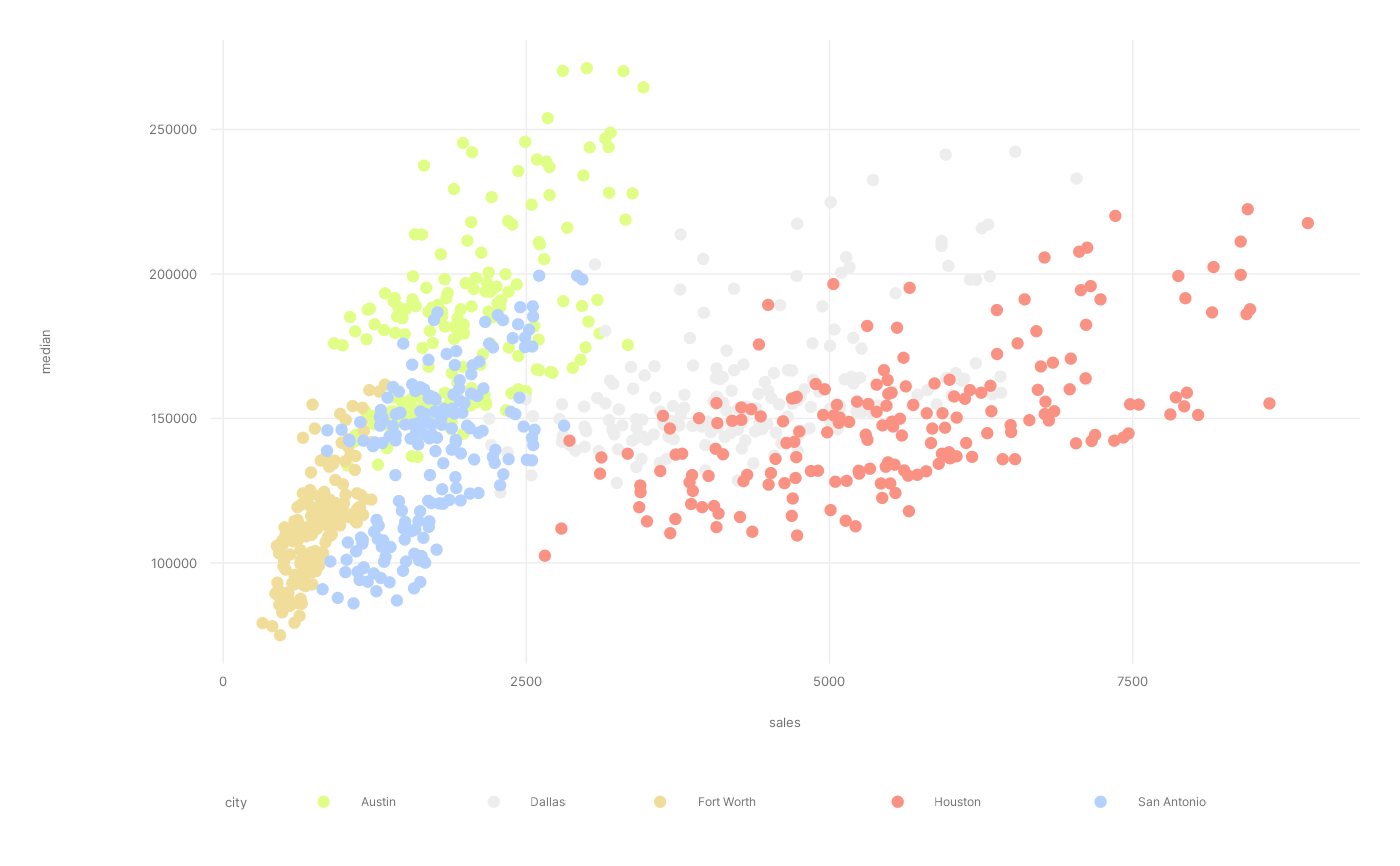
# Use the cesar palette with discrete data (default)
txsamp <- subset(txhousing, city %in%
c("Houston", "Fort Worth", "San Antonio", "Dallas", "Austin"))
(d <- ggplot(data = txsamp, aes(x = sales, y = median)) +
geom_point(aes(colour = city)))
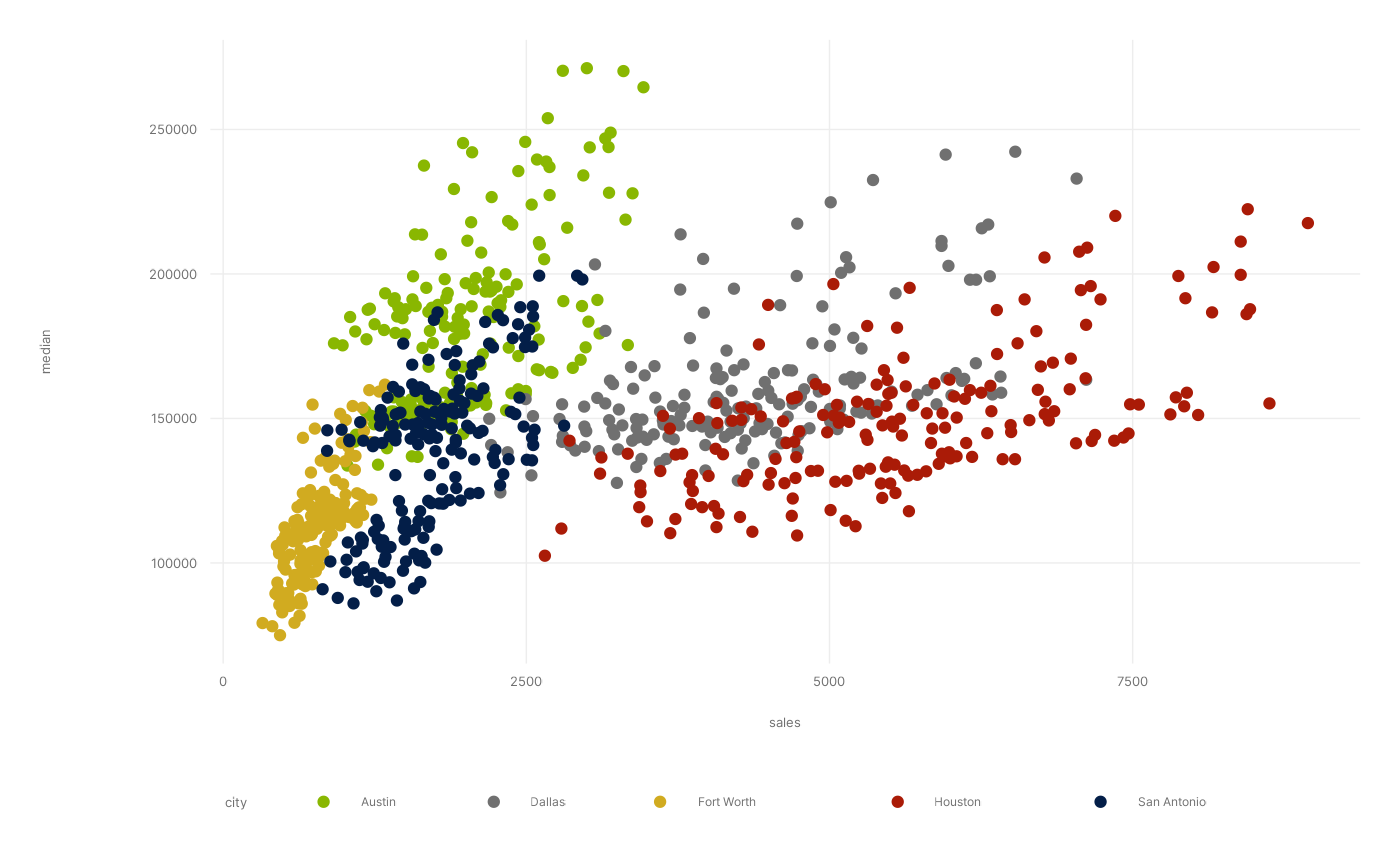
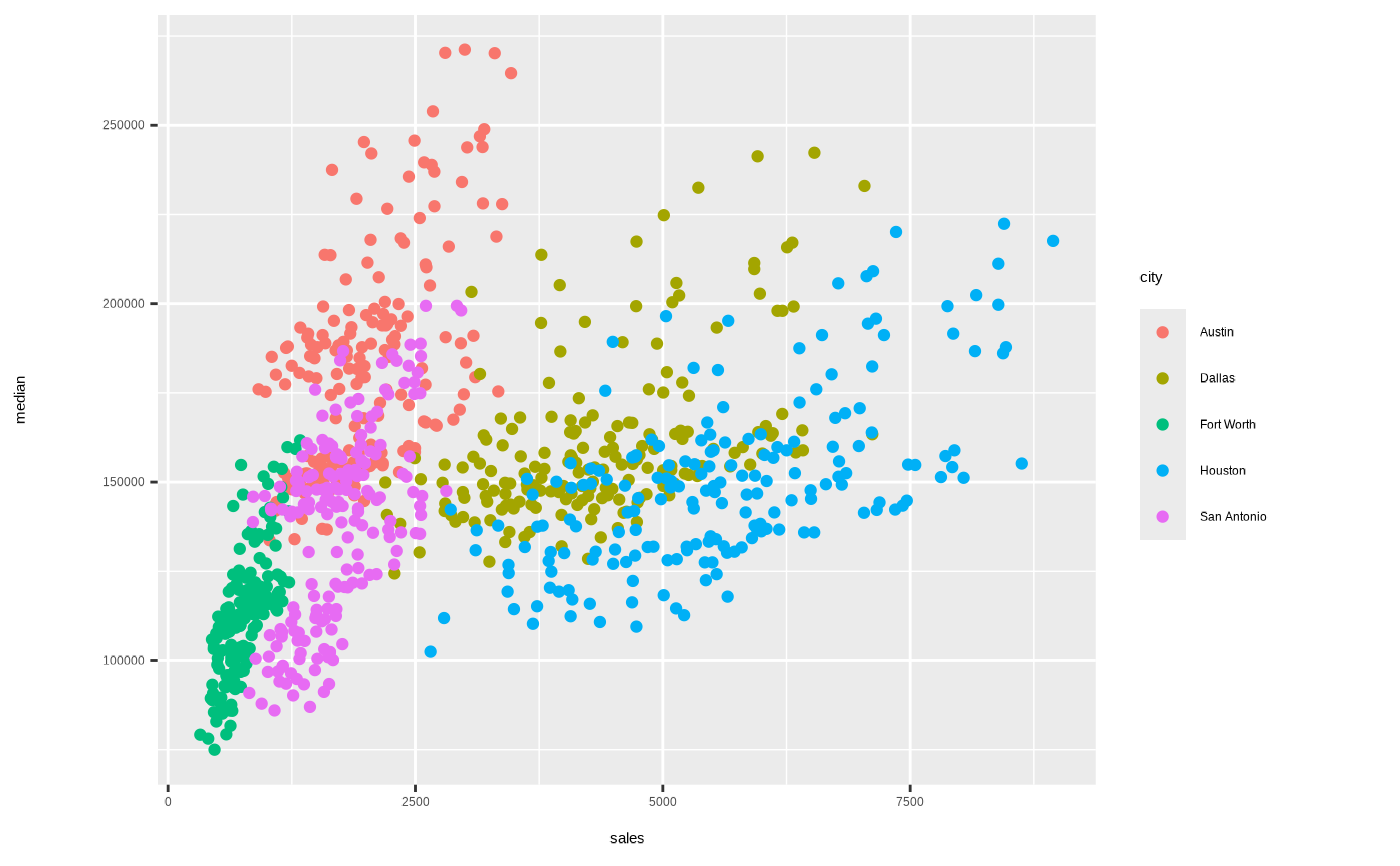 d + theme_cesar() + scale_colour_cesar_d()
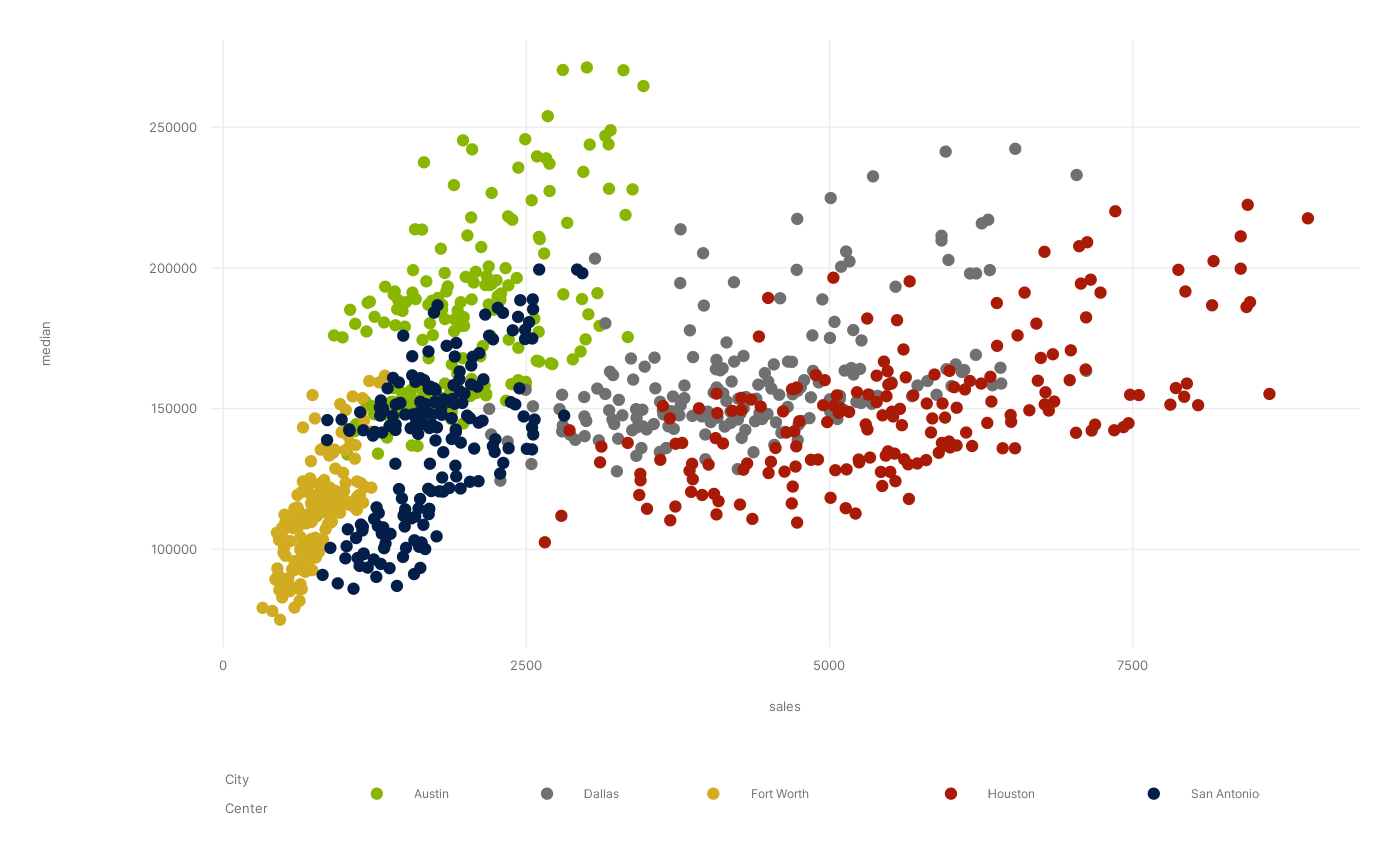
 # Change scale label
d + theme_cesar() + scale_colour_cesar_d("City\nCenter")
# Change scale label
d + theme_cesar() + scale_colour_cesar_d("City\nCenter")
 # Select palette to use from names(cesar_palettes)
d + theme_cesar() + scale_colour_cesar_d(palette = "cesar_light")
# Select palette to use from names(cesar_palettes)
d + theme_cesar() + scale_colour_cesar_d(palette = "cesar_light")
 d + theme_cesar() + scale_colour_cesar_d(palette = "galliano_c")
#> Warning: continuous palette selected and will discretised; consider using one of c("cesar", "cesar_light") instead
d + theme_cesar() + scale_colour_cesar_d(palette = "galliano_c")
#> Warning: continuous palette selected and will discretised; consider using one of c("cesar", "cesar_light") instead
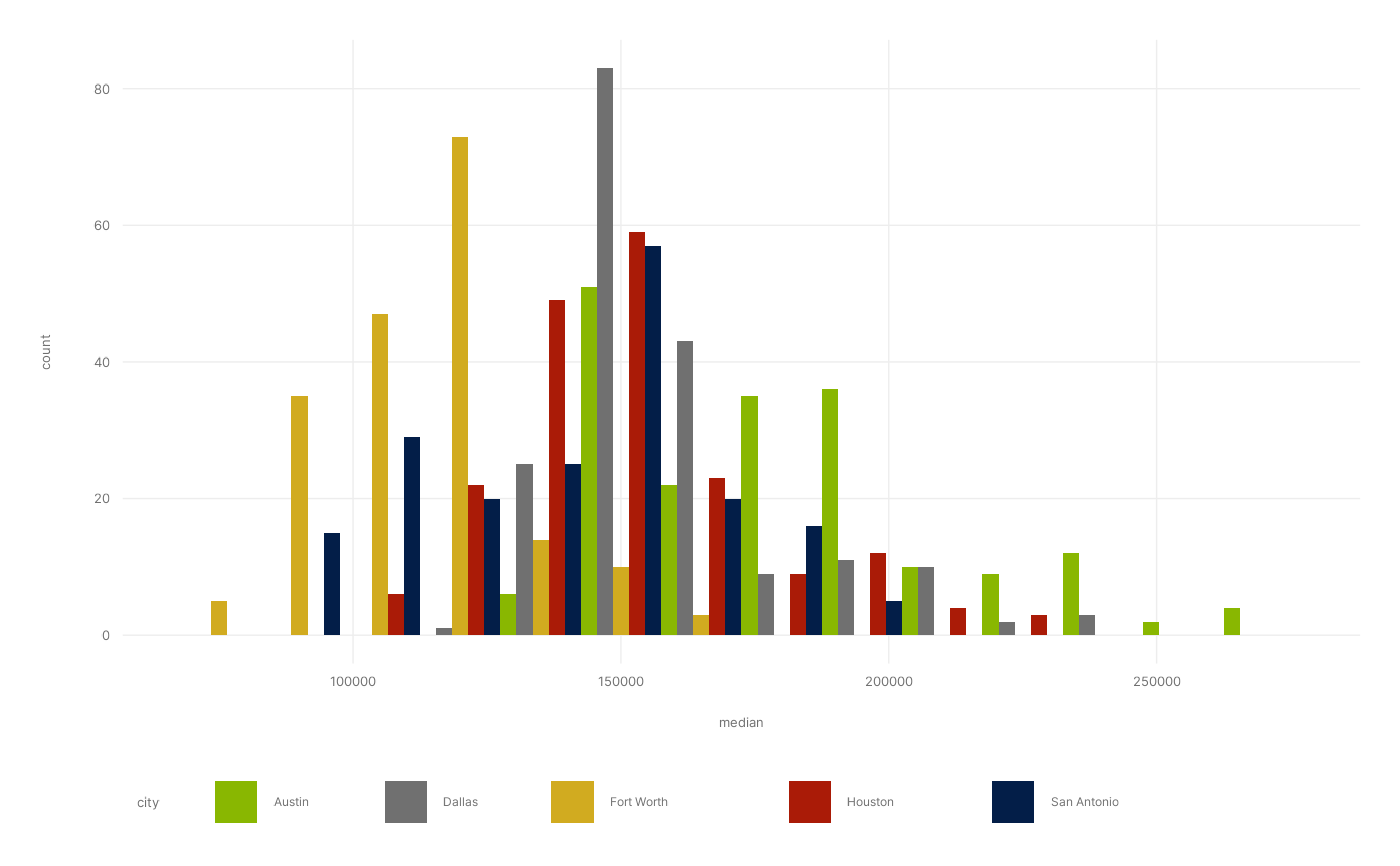
 # scale_fill_cesar_d works just the same as
# scale_colour_cesar_d but for fill colours
p <- ggplot(txsamp, aes(x = median, fill = city)) +
geom_histogram(position = "dodge", binwidth = 15000)
p + theme_cesar() + scale_fill_cesar_d()
# scale_fill_cesar_d works just the same as
# scale_colour_cesar_d but for fill colours
p <- ggplot(txsamp, aes(x = median, fill = city)) +
geom_histogram(position = "dodge", binwidth = 15000)
p + theme_cesar() + scale_fill_cesar_d()
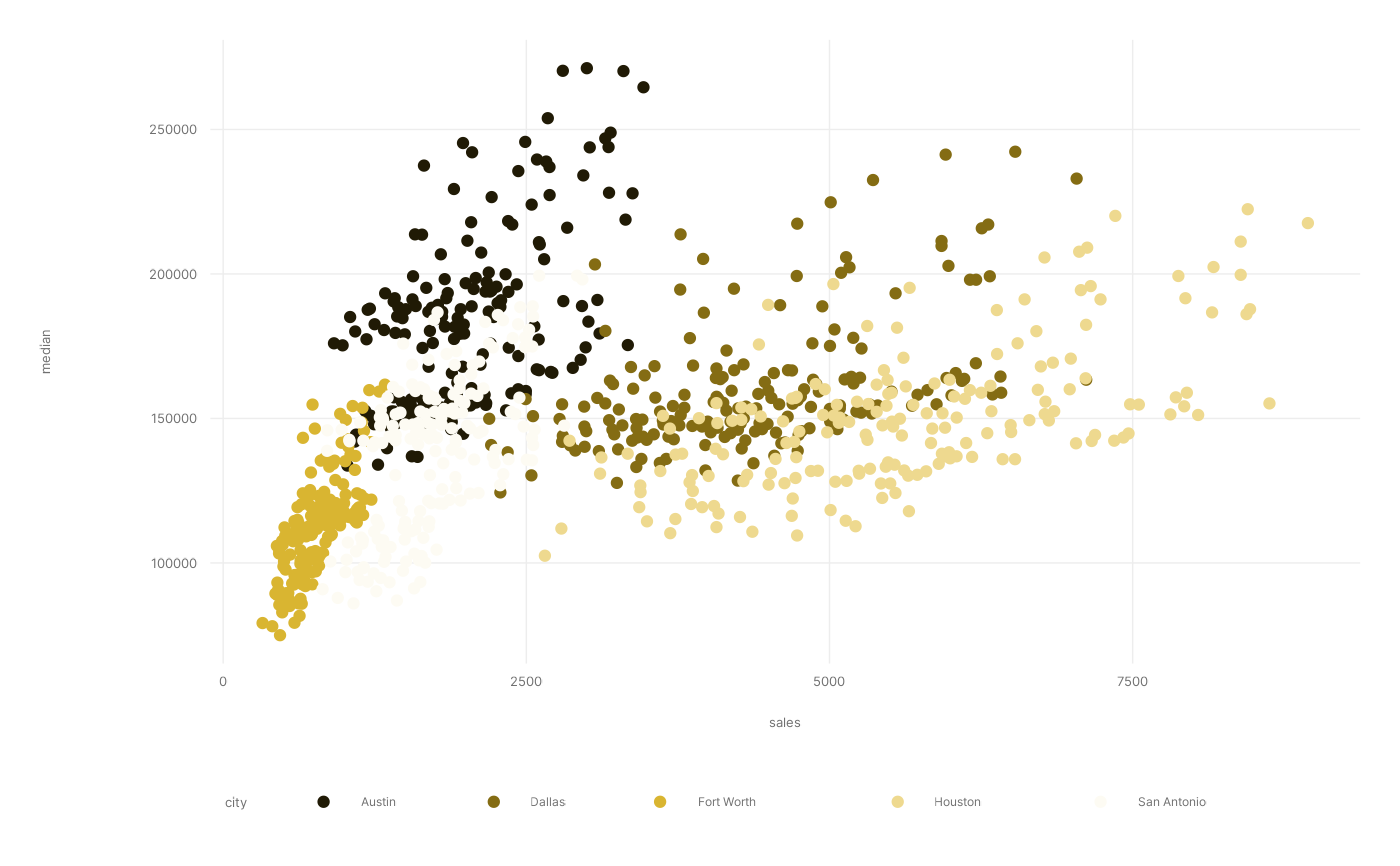
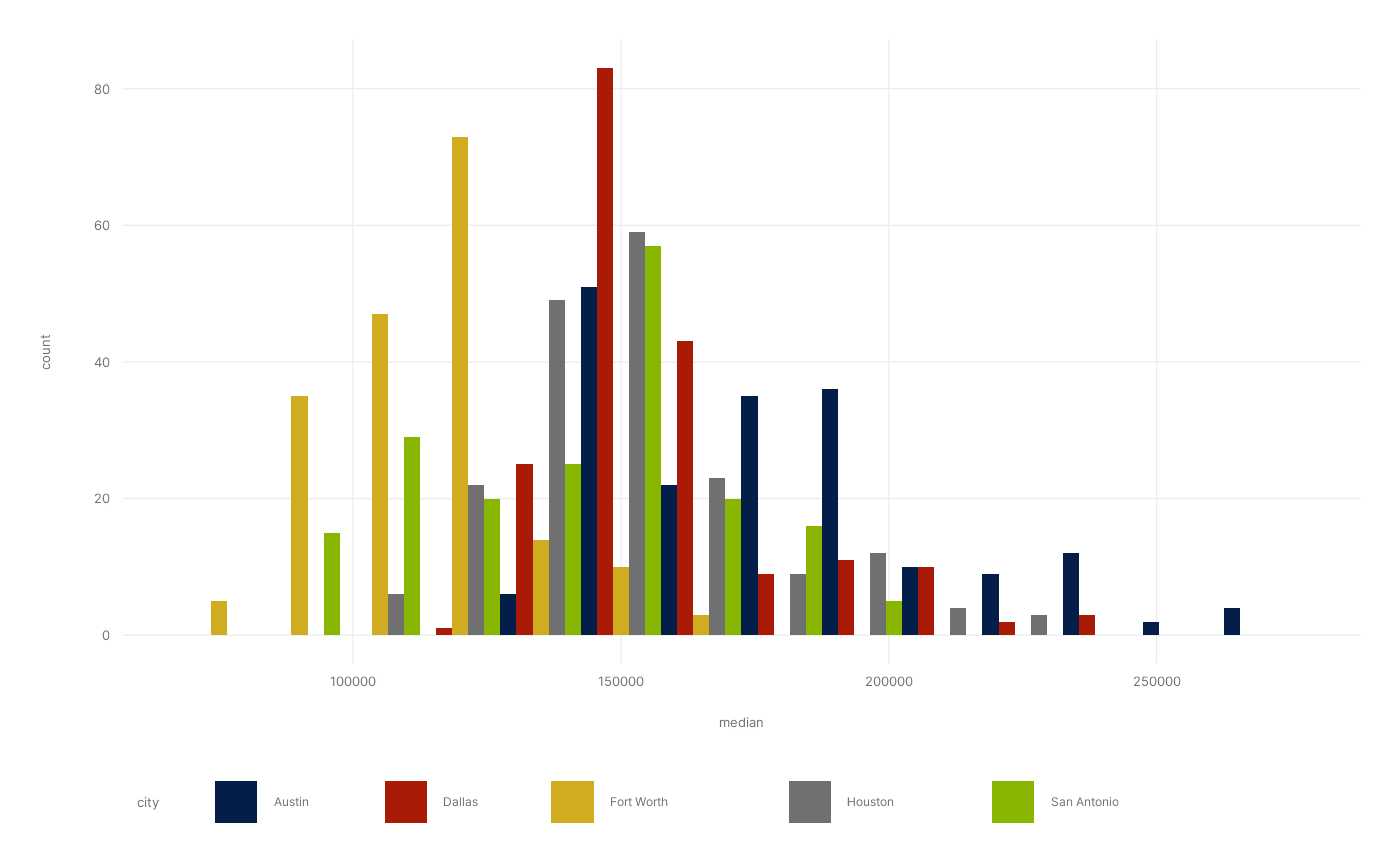
 # the order of colour can be reversed
p + theme_cesar() + scale_fill_cesar_d(reverse = T)
# the order of colour can be reversed
p + theme_cesar() + scale_fill_cesar_d(reverse = T)
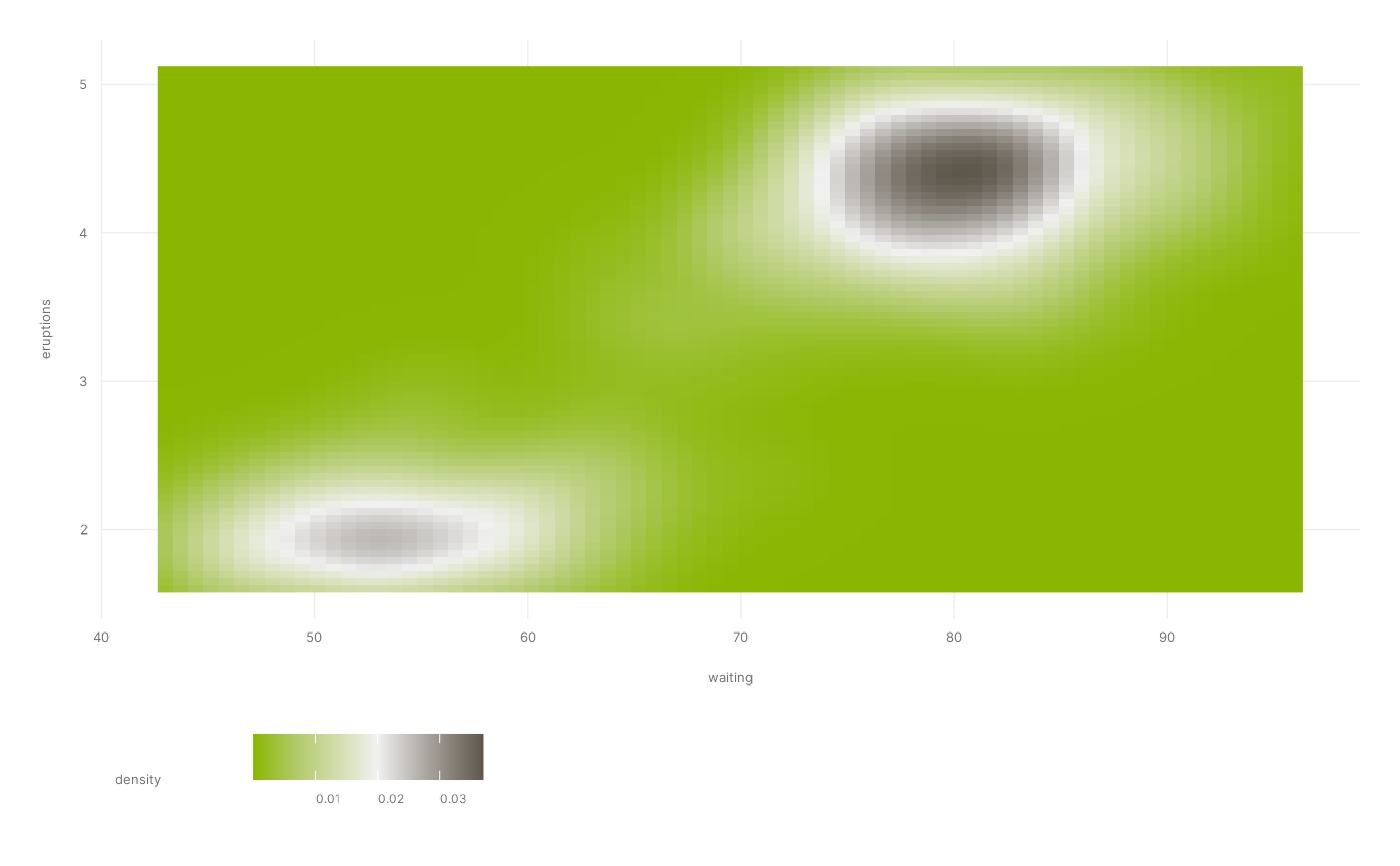
 # Use cesar_c with continuous data
(v <- ggplot(faithfuld) +
geom_tile(aes(waiting, eruptions, fill = density)))
# Use cesar_c with continuous data
(v <- ggplot(faithfuld) +
geom_tile(aes(waiting, eruptions, fill = density)))
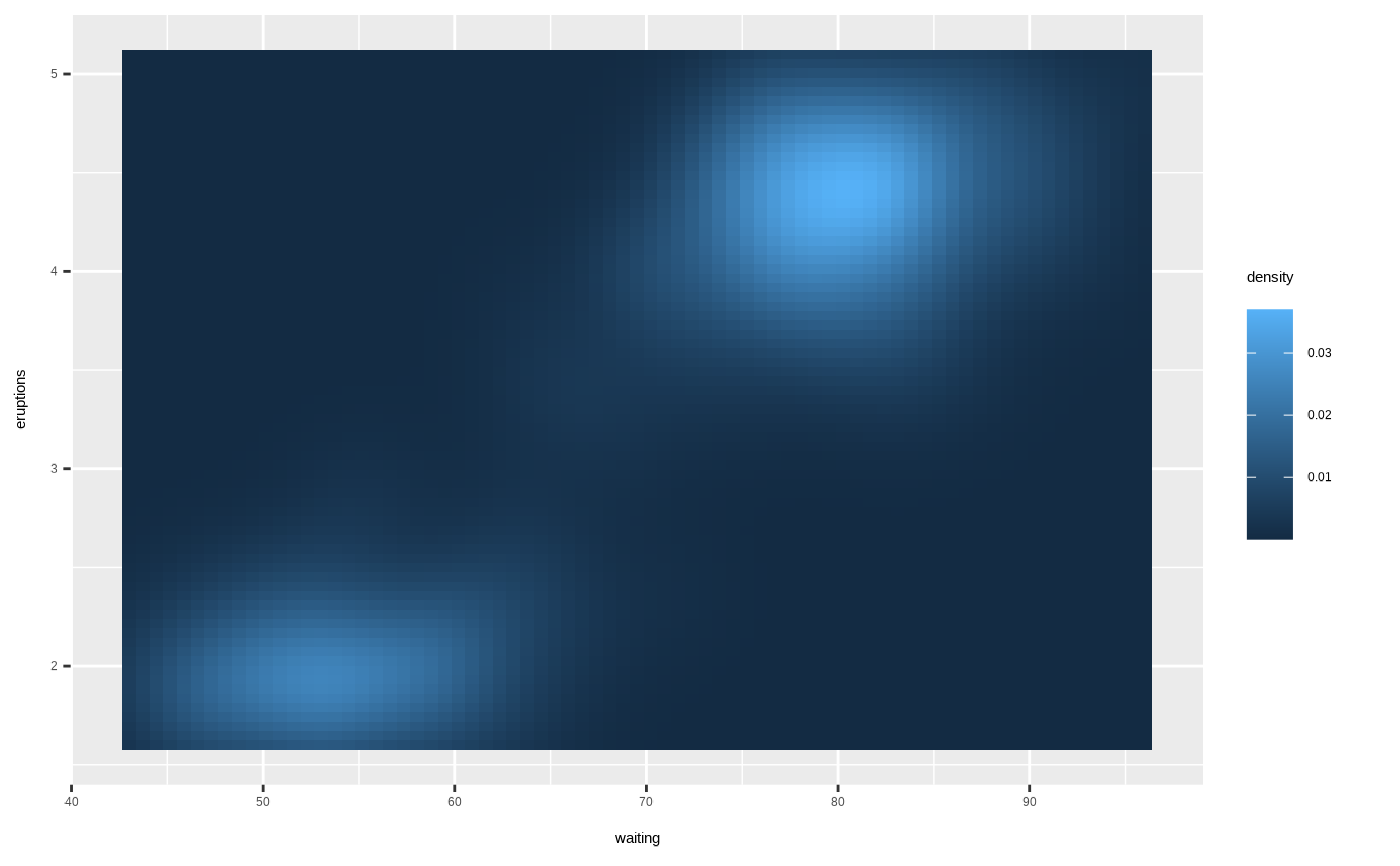 v + theme_cesar() + scale_fill_cesar_c()
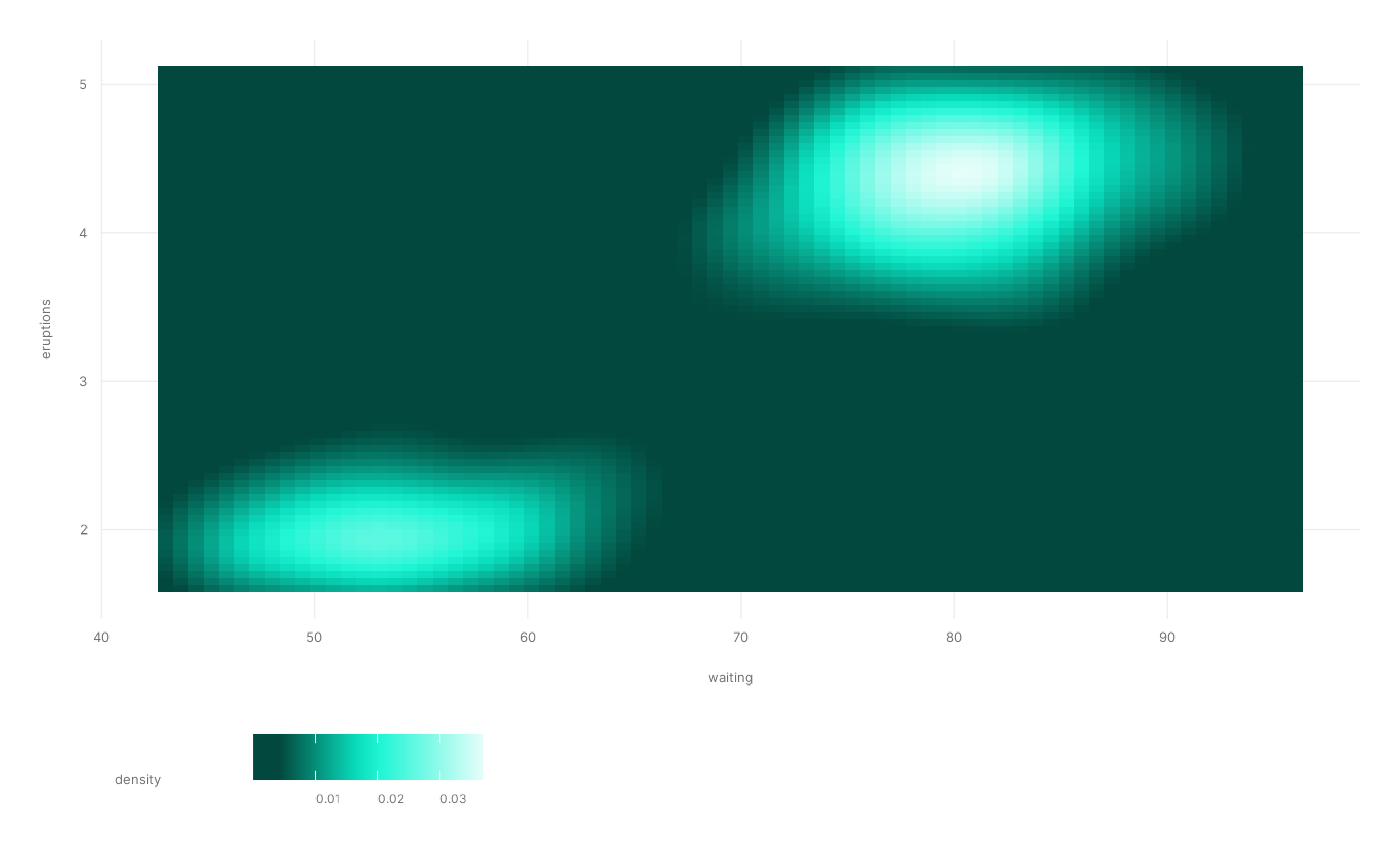
 v + theme_cesar() + scale_fill_cesar_c(palette = "hobgoblin_c")
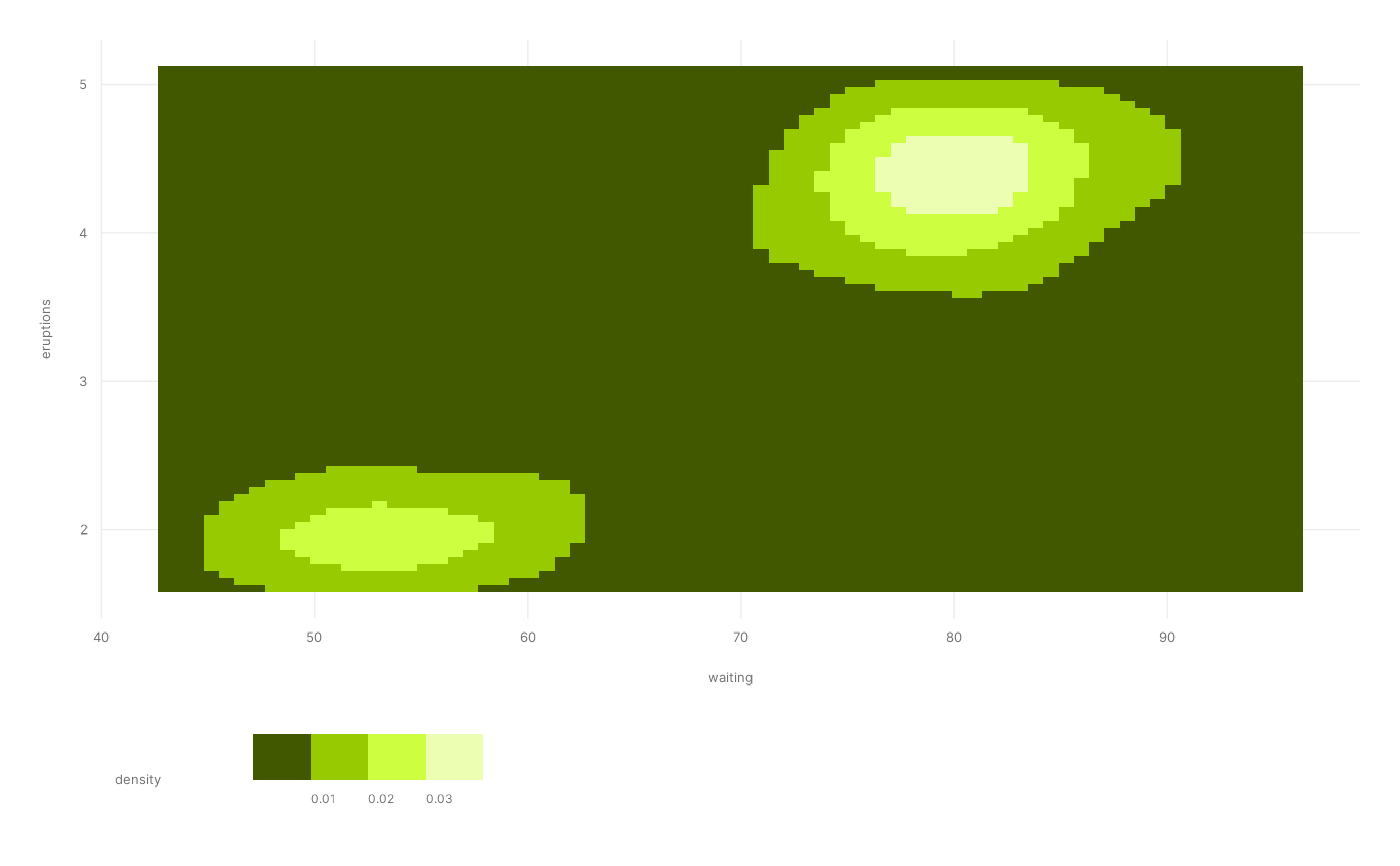
 # Use cesar_b to bin continuous data before mapping
v + theme_cesar() + scale_fill_cesar_b()
# Use cesar_b to bin continuous data before mapping
v + theme_cesar() + scale_fill_cesar_b()
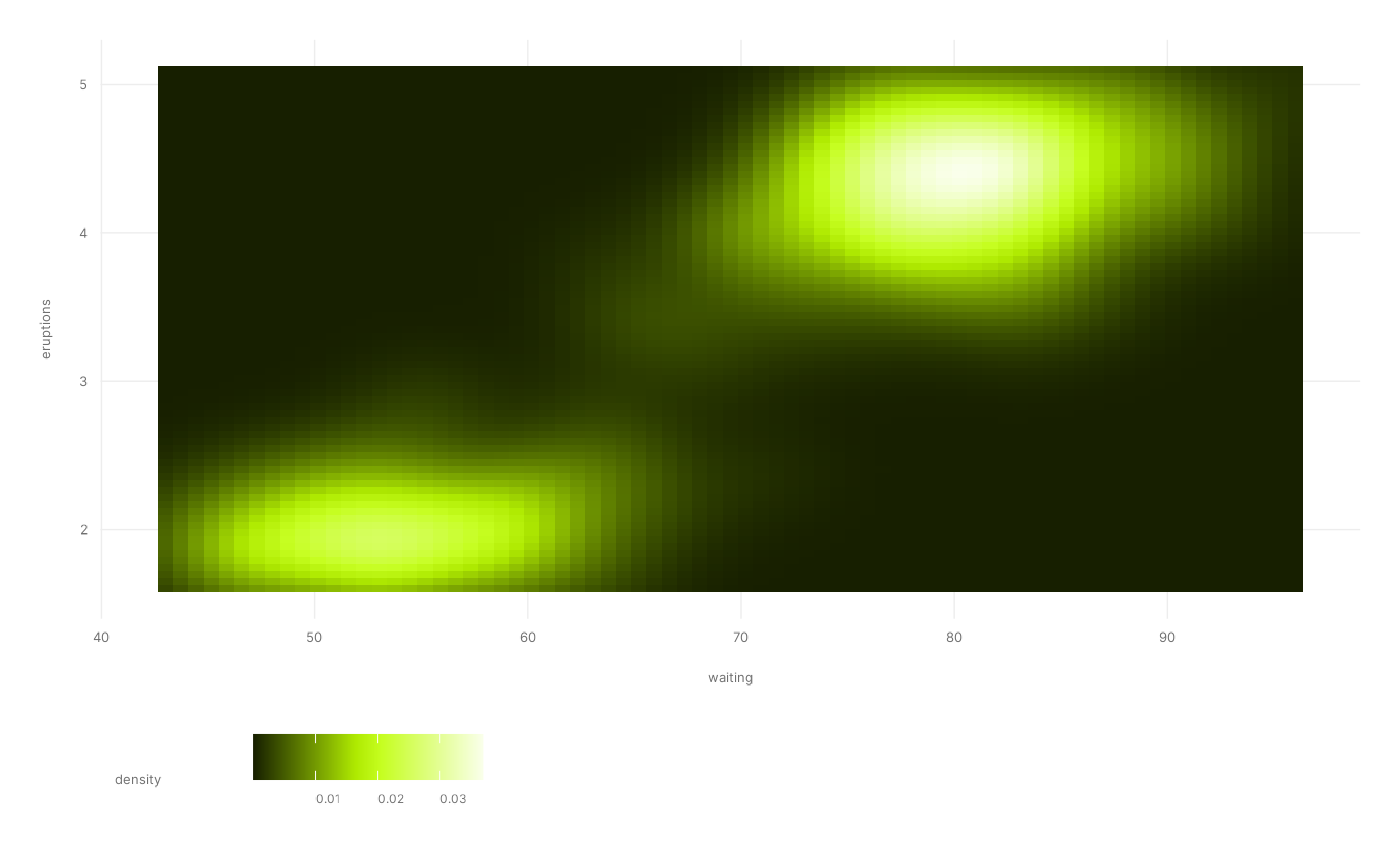
 # Use cesar_g for divergent scales
ggplot(faithfuld, aes(waiting, eruptions)) +
geom_raster(aes(fill = density)) +
scale_fill_cesar_g(mid = 0.02) + theme_cesar()
# Use cesar_g for divergent scales
ggplot(faithfuld, aes(waiting, eruptions)) +
geom_raster(aes(fill = density)) +
scale_fill_cesar_g(mid = 0.02) + theme_cesar()